2020: the driest spring at Phoenix Park in Dublin since records began in 1837
ToggleA global pandemic means water has taken on a new public health importance and created new vulnerabilities, write Dr Simon Noone, Dr Conor Murphy and Csaba Horvath of ICARUS and the Department of Geography These are exceptional times. While the fine weather has served to make Covid-19 lockdown more bearable for many, the dry conditions themselves have been exceptional, especially in the east and in the Dublin region in particular.

Here we analyse precipitation records for the Phoenix Park station dating back to 1837, one of the longest continuous records in Ireland.
We show that 2020 has returned the lowest spring [MAM] rainfall total since at least 1837 and resulted in the development of drought conditions more extreme (and earlier in the year) than in summer 2018.
The month of May, with a total rainfall of 8.3 mm ranks in the top 1% of driest months in the entire Phoenix Park record. However, truly remarkable is the fact that combined rainfall totals for April and May 2020 rank as the driest consecutive two months ever recorded at Phoenix Park, the longest running continuous series in the Republic.
We extracted precipitation totals for spring [MAM] and all spring months from 1837 to 2020. These are plotted in Figure 1. Evident is the very low total for Spring 2020 (52.6 mm), by far and away the lowest spring total in the entire record.
Totals for each month have been low, especially in April and May, but not record breakers on their own. Figure 2 shows just how extreme the spring 2020 totals have been, far lower than any other total recorded in the entire series.
While March totals (30.7 mm) were below average, both April (13.6 mm) and especially May (just 8.3 mm) have been very low. These numbers are not just remarkable for Spring. The combined April and May total is the driest consecutive two month total ever recorded (at any time of the year) at Phoenix Park.
The total for May 2020 lies in the top 1% of driest months ever recorded at the station back to 1837. The total for the three months of March, April and May mark the 5th driest three month period ever recorded across the record.
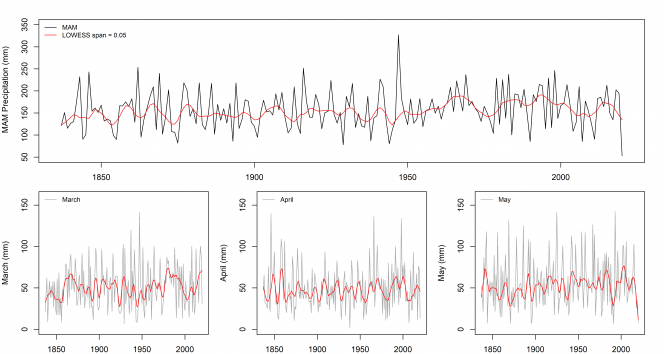
Figure 1 Precipitation totals for Spring [MAM] (top) and for each spring month (bottom) recorded at Phoenix Park, Dublin 1837-2020. Red line is a lowess smoothing function.
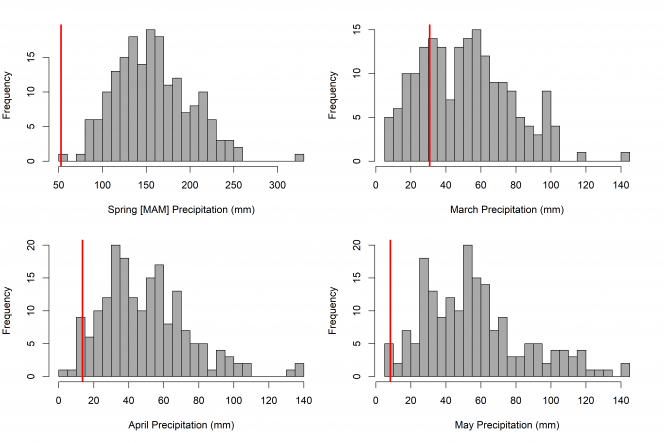
Figure 2 Histograms of spring [MAM] precipitation and for the months of March, April and May at Phoenix Park, Dublin 1837-2020. The red lines show the location of 2020 totals.
‘The current drought event is ongoing'
To examine drought conditions at Phoenix Park we use the Standardised Precipitation Index (SPI) (McKee et al. 1993). SPI is one of the most widely used drought indices and can be used to examine drought of various accumulations. Here we derived SPI-3 to examine how deficits accrued during spring 2020 compare to other droughts in the record. SPI-3 is widely used to measure agricultural drought and soil moisture deficits. SPI values between 0.99 and −0.99 are generally considered to be near normal, −1.00 to −1.49 is moderate drought, −1.50 to −1.99 is severe drought and less than −2.00 is defined as an extreme drought (Noone et al., 2017).
Figure 3 shows the SPI-3 index applied to all months since 1837. Evident is the extreme nature of the drought in which we currently find ourselves. In terms of three month accumulated deficits, the current drought has already surpassed the minimum SPI-3 values for the summer 2018 drought at Phoenix Park. It has done so more than a month earlier also. Across the entire record May 2020 and April 1854 are ranked joint fourth most extreme (SPI-3 = -3.24) drought events. It is worth noting that the current drought event is ongoing and is already in the top 5 most extreme droughts in the series.
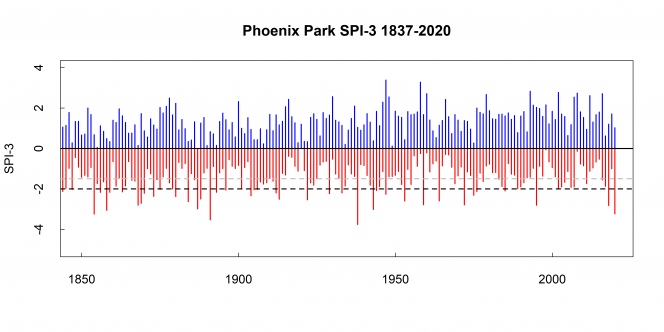
Figure 3 SPI-3 series for Phoenix Park 1837-2020. Blue shows wetter than average periods, red drier than average. The grey dashed horizontal line shows the threshold for severe drought, the black dashed line is the threshold for extreme drought
Figure 4 shows just the Spring SPI-3 series (SPI-3 extracted for May) from 1837 to present. May 2020 is by far the most extreme Spring drought (SPI-3= -3.24) experienced at Phoenix Park in more than 180 years. No other event comes close. This is despite the fact that over the long-term there is a statistically significant trend to less extreme Spring droughts. This should highlight the danger of planning based on the extrapolation of trends.
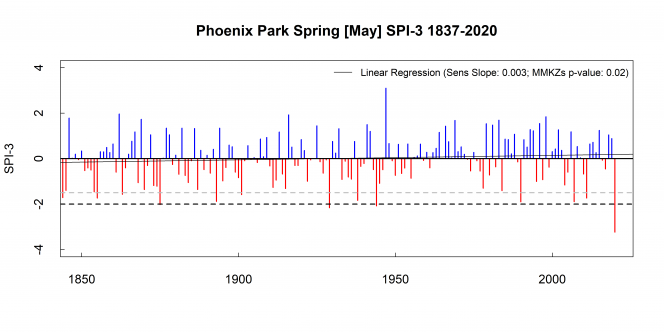
Figure 4 SPI-3 series for spring (May SPI-3) for Phoenix Park 1837-2020. The series shows a statistically significant trend (p=0.02) towards increased SPI-3 values over the long term (i.e. less extreme droughts).
‘A global pandemic means water has taken on a new public health importance and created new vulnerabilities’
The passing of a season causes excitement for us to tally numbers, but the drought continues. The numbers are exceptional to date but large soil moisture deficits exist.
It will take a considerable amount of rain to bring this drought event to an end. While forecasts for the coming week show some rain, it will take considerable receipts to bring conditions back to normal.
The impacts of the 2018 drought live large in the memory. While the drought of 2020 is more limited in spatial scale thus far, affecting the east most intensely, the unfolding situation needs to be carefully monitored. Unlike 2018 we now find ourselves in the midst of a global pandemic where water has taken on a new public health importance and created new vulnerabilities.
References
McKee TB, Doesken NJ, Kleist J. 1993. The relationship of drought frequency and duration of time scales. In Eighth Conference on Applied Climatology. Am. Meteorol. Soc. January 17–23, 1993, Anaheim CA, 179–186.
Noone, S., Murphy, C., Coll, J., Matthews, T., Mullan, D., Wilby, R.L. and Walsh, S., 2016. Homogenization and analysis of an expanded long‐term monthly rainfall network for the Island of Ireland (1850–2010). International Journal of Climatology, 36(8), pp.2837-2853.
Noone, S., Broderick, C., Duffy, C., Matthews, T., Wilby, R.L. and Murphy, C., 2017. A 250‐year drought catalogue for the island of Ireland (1765–2015). International Journal of Climatology, 37, pp.239-254.